
Thirty-nine of the forty-nine exported functions, exercised in the
order of a real workflow, on data simulated in the document itself. The
help pages document the ten that the tour leaves out. They are the
inference helpers se_function() and
profile_theta(), qc_phenotypes(),
parentage_check(), h_inverse(),
read_blupf90_snp(), estimate_gamma(),
half_t(), mcmc_diagnostics() and the
_mt twin of eval_internal(). The test suite
runs all of them. Each chunk runs at build time, so this walkthrough
cannot drift away from the code. The companion vignette (“from data to
breeding value”) tells the story; this one is the tool bench.
Step 0: simulate a population to work on
simulate_breeding() gene-drops haplotypes, so the
genotypes it emits are consistent with the pedigree it emits: one honest
generator for every example.
library(uaitrem)
s <- simulate_breeding(n_founders = 40, n_generations = 2,
                       offspring_per_generation = 80, h2 = 0.4,
                       n_markers = 200, seed = 7)
str(s, max.level = 1)
#> List of 4
#>  $ pedigree :'data.frame':   200 obs. of  3 variables:
#>  $ data     :'data.frame':   200 obs. of  3 variables:
#>  $ tbv      : Named num [1:200] 1.447 -0.757 -0.439 -0.261 -0.614 ...
#>   ..- attr(*, "names")= chr [1:200] "F001" "F002" "F003" "F004" ...
#>  $ genotypes:List of 2
Step 1: the pedigree toolbox
p <- pedigree(s$pedigree)      # topological order + Meuwissen-Luo (1992) inbreeding
head(p, 3)
#> Pedigree with 3 animals, 3 founder(s)
#> Mean F 0, maximum 0, 0 animal(s) with F > 0
#>     id sire dam F
#> 1 F001   NA  NA 0
#> 2 F002   NA  NA 0
#> 3 F003   NA  NA 0
ai <- a_inverse(s$pedigree)    # Henderson's (1976) sparse A^-1, as triplets i/j/x/n
str(ai[c("i", "j", "x", "n")])
#> List of 4
#>  $ i: int [1:674] 1 4 19 29 39 47 76 96 113 2 ...
#>  $ j: int [1:674] 1 1 1 1 1 1 1 1 1 2 ...
#>  $ x: num [1:674] 3 0.5 0.5 0.5 0.5 -1 -1 -1 -1 3 ...
#>  $ n: int 200
a22_inverse() takes 1-based positions in the topological
order of pedigree():
gid <- s$genotypes$ids[141:200]
a22i <- a22_inverse(s$pedigree, geno = match(gid, p$id))
dim(a22i)
#> [1] 60 60
A pedigree whose third column holds the MATERNAL GRANDSIRE is
declared, never guessed: read as a dam, the grandsire would enter with
weight 1/2 where the grandsire rules give 1/4 (Mrode and Pocrnic, 2023,
secs. 3.6 and 3.7), and no check downstream could see it.
sire_mgs() declares it, the declaration travels to every
fitter, and a third column named mgs that was not declared
is an error:
bulls <- data.frame(id = c("s1", "s2", "s3", "s4"), sire = c("0", "0", "s1", "s3"),
                    mgs = c("0", "0", "s2", "s2"))
pedigree(sire_mgs(bulls))                  # s4: F = 1/16 through the grandsire s2
#> Sire / maternal-grandsire pedigree with 4 animals, 2 founder(s)
#> Mean F 0.015625, maximum 0.0625, 1 animal(s) with F > 0
#>   id sire mgs      F
#> 1 s1   NA  NA 0.0000
#> 2 s2   NA  NA 0.0000
#> 3 s3    1   2 0.0000
#> 4 s4    3   2 0.0625
Step 2: fit the base animal model, read everything out of it
fit <- model(y ~ cg + animal(id), s$data, s$pedigree)
fit
#> AI-REML fit of 'y'
#>   converged in 5 iteration(s), relDelta 9.88e-09, Newton decrement 7.07e-19, 0.002 s
#>   -2logL 199.7822977
#>   200 record(s), 203 column(s) in the equations
#>   fixed column(s) removed for linear dependence: cg=g1
#>
#>      component estimate std_error  share correlation
#>    var(animal) 0.416329  0.153150 0.3998
#>  var(residual) 0.625017  0.115851 0.6002
#>
#> fixed effects (implicit intercept; dropped columns are zero; compare by contrast):
#> intercept     cg=g3     cg=g2
#> 10.053836  0.157695  0.270621
summary(fit)
#> AI-REML fit of 'y'
#>   -2logL 199.7822977
#>
#>      component estimate std_error  share correlation
#>    var(animal) 0.416329  0.153150 0.3998
#>  var(residual) 0.625017  0.115851 0.6002
#>
#> fixed effects (implicit intercept; dropped columns are zero; compare by contrast):
#> intercept     cg=g3     cg=g2
#> 10.053836  0.157695  0.270621
#>
#> share: each variance or covariance over the phenotypic variance of its trait,
#> covariances included, the same denominator as h2(); in an animal model the
#> var(animal) row is h2, in a sire model h2() is four times the var(sire) row.
#> A covariance BETWEEN traits, a correlation parameter such as
#> rho(residual), and every row of a model with indirect() have no share.
#> correlation: each covariance over the square root of the two variances it links.
#> For a standard error of either, se_function(fit, function(th) ...) applies the
#> delta method over 2 AI^-1; near a boundary use profile_theta().
coef(fit)
#>   var(animal) var(residual)
#>     0.4163289     0.6250168
round(h2(fit), 3)                           # simulated truth: 0.4
#> [1] 0.4
h2() takes the numerator by name and divides by the
phenotypic variance of the trait: the variances and covariances. In an
animal model it is the share of var(animal) in
the printed table.
The fixed effects travel in the same solution vector, named
term=level. The parametrization is the implicit intercept
with dropped columns at zero, so a table from another convention (the
book’s, BLUPF90’s) agrees only on CONTRASTS between levels:
coef(fit, effects = "fixed")                # the same vector as fit$b
#>  intercept      cg=g3      cg=g2
#> 10.0538358  0.1576951  0.2706208
e <- ebv(fit)                               # named vector, all pedigree animals
acc <- accuracy(fit, s$pedigree)            # with the (1+F) in the denominator
round(cor(e[names(s$tbv)], s$tbv), 2)       # against the simulator's own truth
#> [1] 0.76
summary(acc)
#>    Min. 1st Qu.  Median    Mean 3rd Qu.    Max.
#>  0.6644  0.6947  0.7043  0.7156  0.7316  0.8034
head(solutions(fit, s$pedigree), 3)         # id, ebv, se, acc, sorted by ebv
#>         id      ebv        se       acc
#> 194 G2_074 1.192297 0.4650242 0.6932424
#> 157 G2_037 1.155299 0.4660570 0.6915745
#> 1     F001 1.128142 0.4455174 0.7233587
Step 3: the formula markers, one by one
Repeated records ask for a permanent environment;
random() is the iid effect for litter or batch; a
missing-value code leaves the likelihood via
missing_code=:
d3 <- s$data[rep(1:nrow(s$data), each = 2), ]
d3$y <- d3$y + rnorm(nrow(d3), 0, 0.5)
d3$y[1] <- -999
d3$lot <- sample(sprintf("lot%02d", 1:20), nrow(d3), TRUE)
f4 <- model(y ~ cg + random(lot) + animal(id) + pe(id), d3, s$pedigree,
            missing_code = -999)
round(f4$theta, 3)
#>   var(random)   var(animal)       var(pe) var(residual)
#>         0.000         0.473         0.619         0.282
A random() with fewer than five levels warns that its
variance is barely determined; three lots, or a litter numbered by
parity, would.
The full maternal model of Mrode and Pocrnic (2023, Eqn 8.1): direct
and maternal genetic share ONE covariance matrix via
group=, and there is ONE permanent environment, the dam’s,
which carries her non-additive maternal genetics as well.
d5 has two records per animal, so a second
pe() on the animal itself is identifiable here too; on one
record per animal it would BE the residual. Two pe() in one
model must be NAMED:
d5 <- d3
d5$dam <- s$pedigree$dam[match(d5$id, s$pedigree$id)]
d5 <- d5[d5$dam != "0", ]
f5 <- model(y ~ cg + animal(id, group = "g") + maternal(dam, group = "g") +
              pe(id, nome = "pe_animal") + pe(dam, nome = "pe_dam"),
            d5, s$pedigree, missing_code = -999)
names(f5$theta)
#> [1] "var(animal)"          "cov(maternal,animal)" "var(maternal)"
#> [4] "var(pe_animal)"       "var(pe_dam)"          "var(residual)"
The reaction norm is rn() over a basis you build with
legendre(); h2_curve() and plot()
then read h2 along the gradient, and h2() refuses the fit,
because here the heritability is a function of the gradient and not one
number. The pe(id) beside the norm needs repeated records:
with one record per animal it IS the residual, and the fit says SINGULAR
and names the two. So the example reuses the two records per animal of
d3, each at its own THI:
d6 <- d3
d6$thi <- runif(nrow(d6), 55, 80)
d6 <- cbind(d6, legendre(d6$thi, order = 1, limits = c(55, 80)))
f6 <- model(y ~ cg + rn(id, base = c("phi0", "phi1")) + pe(id), d6, s$pedigree,
            missing_code = -999)
head(h2_curve(f6, limits = c(55, 80), points = 5))
#>       x        va        h2
#> 1 55.00 0.7119527 0.4500155
#> 2 61.25 0.5822518 0.4009000
#> 3 67.50 0.4844079 0.3576239
#> 4 73.75 0.4184211 0.3247272
#> 5 80.00 0.3842914 0.3063544
plot(f6, limits = c(55, 80))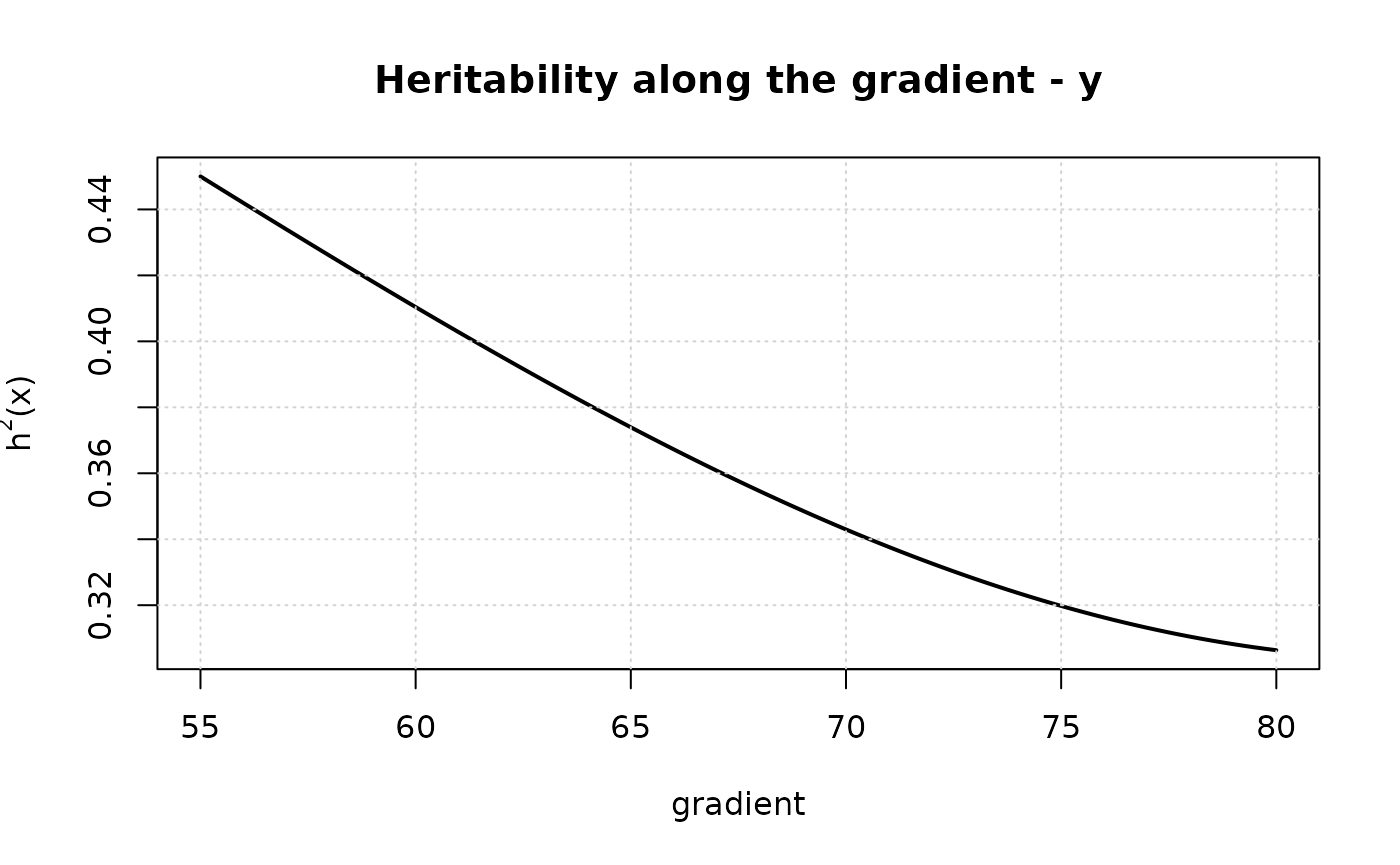
A sire model uses sire() when only males carry the
genetic term. Unknown-parent groups enter as metafounders (Legarra et
al., 2015): a parent label with no line of its own, declared with its
gamma:
Step 4: genomics, from files and QC to the single step
read_plink() reads the binary trio (or a .raw); here we
write a tiny .bed by hand so the example carries its own truth:
pref <- file.path(tempdir(), "toy")
codes <- c(`2` = 0L, `1` = 2L, `0` = 3L)                 # 2 bits per genotype
pack <- function(g) { v <- codes[as.character(g)]
  sum(v * 4L^(seq_along(v) - 1L)) }
con <- file(paste0(pref, ".bed"), "wb")
writeBin(as.raw(c(0x6c, 0x1b, 0x01, pack(c(2, 1, 0, 2)), pack(c(0, 0, 1, 1)))), con)
close(con)
writeLines(sprintf("F%d I%d 0 0 0 -9", 1:4, 1:4), paste0(pref, ".fam"))
writeLines(sprintf("1 SNP%d 0 %d A B", 1:2, 1:2), paste0(pref, ".bim"))
read_plink(pref)$m
#>      SNP1 SNP2
#> [1,]    2    0
#> [2,]    1    0
#> [3,]    0    1
#> [4,]    2    1
qc_genotypes() filters animals and markers by call rate,
markers by MAF and (optionally) HWE, and reports what each filter
removed: silent filtering is how panels lose the markers that
mattered.
q <- qc_genotypes(s$genotypes, min_call_rate = 0.9, min_maf = 0.05)
c(animals = length(q$ids), kept = ncol(q$m), by_call = q$n_call, by_maf = q$n_maf)
#> animals    kept by_call  by_maf
#>     200     200       0       0
The APY core can be chosen by rule: apy_core_select()
counts the eigenvalues of G that explain 98% of its trace (Pocrnic et
al., 2016) and draws that many animals at random with a recorded seed,
and apy_core = "auto" does the same inside a fit. On a
genotyped set this small the rule asks for nearly every animal, and the
function warns when one factorization with the core costs more than half
of the exact one; size = overrides the count and the table
of counts is still reported:
gen <- list(ids = gid, m = s$genotypes$m[141:200, ])
core <- apy_core_select(gen, size = 25)
core
#> APY core: 25 of 60 genotyped, explaining 72.0% of G (200 markers, seed 1)
#> eigenvalues of G for 90/95/98/99% of its trace: 41 / 48 / 54 / 56
#> one factorization with this core costs 41.0% of the exact one
The single step is an argument, not a function:
genotypes= upgrades A to H. The inverse of G* is exact by
default, and apy_core= uses a global core:
fss <- model(y ~ cg + animal(id), s$data, s$pedigree, genotypes = gen)
fap <- model(y ~ cg + animal(id), s$data, s$pedigree, genotypes = gen,
             apy_core = core)
round(c(apy = cor(ebv(fss, "animal"), ebv(fap, "animal"))), 3)
#>   apy
#> 0.992
fss$dense_block                             # the k of the k^3 each factorization pays
#>   dense columns
#>      66     203
Without apy_core= the dense block of the factor holds at
least every genotyped animal, and the fill of the pedigree can add to
it.
The standalone inverse exposes the same approximation with its
diagnostics (the Mendelian/conditional residual of each animal), and
g_matrix() builds the raw VanRaden G of the book’s examples
(no blend, no A22 adjustment):
ap <- apy_inverse(gen$m, core = 1:30)
G  <- g_matrix(gen)
c(min_apy_res = round(min(ap$mendeliano), 3), diag_G = round(mean(diag(G)), 3))
#> min_apy_res      diag_G
#>       0.586       0.981
Marker effects come out of a single-step fit by backsolving, or
directly by fitting the markers as equations with
snp_blup(), the path that never builds G (theta is GIVEN,
the routine-evaluation flow):
a_hat <- snp_effects(fss, s$pedigree, gen)
fsnp <- snp_blup(y ~ cg + animal(id), s$data, s$pedigree, gen,
                 theta = unname(fss$theta))
round(cor(unclass(a_hat), fsnp$g[!is.na(fsnp$g)]), 3)
#> [1] 1
pegs() is the multi-environment route of Xavier and
Habier (2022): no mixed model equations, no relationship matrix, the
effects of one marker for every environment solved together by
randomized Gauss-Seidel. It assumes the residuals of different
environments are independent, which holds when each animal is recorded
in one place; for traits of the same record, model_mt().
Here the herds of the simulated data stand in for environments. It is
ONE trait, so every true correlation is 1; with 60 animals split three
ways the estimates below are noise, which is what pseudo-expectation
gives on data this small (the method needs thousands of animals to pin
r_g down):
Step 5: multi-trait
cbind() on the left, full R0, missingness handled record
by record; rg() reads the genetic correlation:
Step 6: the Bayesian half
gibbs() samples the SAME models; ess() and
geweke_z() are the chain diagnostics (also computed
automatically on the result). With theta_fixed= it samples
only the locations, the mode whose posterior mean must be the BLUP. Left
unset, the prior is the hierarchical half-t of half_t() on
a scalar term such as animal(id) here, "flat"
on a covariance group and on the residual, and the interweaving step of
Yu and Meng (2011) runs on every estimated term (asis);
prior = puts one prior on every term
("jeffreys", "flat",
"uniform_sd", "half_t" or a proper
c(df =, scale =)) and leaves that step off, and
family = "probit" samples a binary trait on its liability,
where the default prior is half_t(df = 4) with a normal
prior on the fixed effects and the PX-DA move (px).
summary() gives the posterior quantiles and the
heritability computed draw by draw. chains = 3 runs
independent chains (their seeds come from set.seed(), and
cores = runs them at the same time with the same result),
pools them, and adds rhat(), the rank-normalized split
R-hat of Vehtari et al. (2021):
gb <- gibbs(y ~ cg + animal(id), s$data, s$pedigree,
            n_iter = 2000, burnin = 400, thin = 4, chains = 3)
summary(gb)
#> 3 Gibbs chains for 'y', 1200 kept sample(s)
#>
#>      component    mean      sd    q2.5   q50.0   q97.5  rhat ess_bulk ess_tail
#>    var(animal) 0.41368 0.14940 0.16539 0.40012 0.73003 1.001      491      524
#>  var(residual) 0.65329 0.11945 0.43959 0.64868 0.91042 1.003      508      695
#>  mcse_mean mcse_q2.5 mcse_q50.0 mcse_q97.5 status
#>     0.0069    0.0093     0.0074     0.0240     ok
#>     0.0051    0.0130     0.0063     0.0093     ok
#>
#> posterior of the ratio, computed sample by sample:
#>                     ratio  mean     sd   q2.5  q50.0  q97.5  rhat ess_bulk
#>  var(animal) / phenotypic 0.383 0.1144 0.1721 0.3807 0.6011 1.002      451
#>  ess_tail mcse_mean mcse_q2.5 mcse_q50.0 mcse_q97.5 status
#>       562    0.0054      0.01     0.0062       0.02     ok
#>
#> fixed effects, posterior mean (implicit intercept; compare by contrast):
#>       term      mean       sd
#>  intercept 10.054585 0.152056
#>      cg=g3  0.159963 0.159514
#>      cg=g2  0.274437 0.168776
#>
#> convergence: ok (no diagnostic found a problem); mcmc_diagnostics() has the full table
round(c(ess = ess(gb$chain_samples[[1]][, "var(animal)"]),
        geweke = geweke_z(gb$chain_samples[[1]][, "var(animal)"]),
        rhat = rhat(sapply(gb$chain_samples, function(m) m[, "var(animal)"]))), 3)
#>     ess  geweke    rhat
#> 141.782   0.051   1.001
Step 7: selection decisions
idx <- selection_index(list(y = ebv(fit, "animal"),
                            y2 = ebv(fmt, "animal", trait = "y2")),
                       weights = c(y = 2, y2 = 1))
head(idx, 3)
#>     F001   G2_074   G2_037
#> 7.232769 6.844100 6.669325
drift <- rank_drift(ebv(fit, "animal"), ebv(fss, "animal"), top = 50)
c(spearman = round(drift$spearman, 3), retention = drift$retention)
#>  spearman retention
#>     0.981    47.000
Step 9: the exposed internals
The internals are exported for the gates, and they double as sparse
tools: the same triplet list i/j/x/n that
a_inverse() returns feeds all three:
ch <- sparse_chol(ai)                        # minimum degree (George & Liu 1989; dense
                                             # nodes set aside as in AMD) + symbolic + factor
x1 <- sparse_solve(ai, rep(1, ai$n))         # SOLVES A^-1 x = 1, so x = A %*% 1: the
                                             # row sums of A, without ever forming A
si <- selected_inverse(ai)                   # A at the factor's pattern (PEV reads this)
round(c(logdet = ch$logdet, x1_first = x1[1]), 3)
#>   logdet x1_first
#>  110.904    4.000
inv_pd(matrix(c(4, 1, 1, 3), 2))             # dense positive-definite inverse
#>             [,1]        [,2]
#> [1,]  0.27272727 -0.09090909
#> [2,] -0.09090909  0.36363636
br_version()
#> [1] "0.5.0"
br_threads()                                 # OpenMP threads of the dense tail (default 1)
#> $threads
#> [1] 1
#>
#> $available
#> [1] 4
#>
#> $openmp
#> [1] TRUE
#>
#> $lapack
#> [1] FALSE
And eval_internal() (with its _mt twin)
evaluates -2logL by the TWO independent routes at any theta: the
identity every gate in the package leans on.
ev <- eval_internal(y ~ cg + animal(id), s$data, s$pedigree, theta = c(0.4, 0.6))
round(abs(ev$neg2logl - ev$neg2logl_V), 10)
#> [1] 0
Step 10: the observed and the liability scale
h2_observed() and h2_liability() are the
Dempster and Lerner conversion between the 0/1 observed scale and the
liability scale: at incidence 0.234 half the heritability is scale, not
biology.
round(c(observed = h2_observed(0.1781, 0.234),
        liability = h2_liability(0.0934, 0.234)), 4)
#>  observed liability
#>    0.0934    0.1781
The rule behind the tour
A new model is almost never a new function: it is a marker inside the
formula of one engine. A sibling fitter exists only when the mathematics
changes: model_mt() (the residual becomes R0),
gibbs() (the algorithm samples instead of maximizing) and
snp_blup() (a fixed-components solver with markers as
equations). Everything else orbits the fit.